
Refonte

La Refonte insights
UX and UI are complementary disciplines that determine a website's success. Understand the definitions, differences, salaries, five-stage method and mistakes SMEs should avoid.
Refonte
Design

SEO
UX, or User Experience, improves a person's journey and satisfaction with a digital product. UI, or User Interface, designs the colours, buttons and typography that make that journey intuitive. Together, they turn a basic website into a conversion engine. To take this further, read Ecommerce Website Redesign.
UX covers the overall experience of a digital product, while UI is its visual and interactive layer. According to Forrester Research (2024), every euro invested in UX returns €100: an ROI of 9,900%.
Yet 70% of French SMEs still confuse the disciplines and underinvest in one or both. If bounce rate exceeds 55%, an imbalance between UX and UI is often responsible. Understanding the difference directs the design budget towards the greatest effect on conversions and revenue.
9,900%
Average UX design ROI (Forrester, 2024)
88%
Of visitors do not return after a poor experience (NNGroup, 2024)
38%
Of users leave an unattractive site (Adobe, 2024)
+200%
Growth among companies investing in design (McKinsey, 2024)
UX design covers everything visitors feel while navigating: journey flow, loading speed, ease of finding information and overall satisfaction. A UX designer researches users, builds wireframes and tests prototypes before a line of code is written. The aim is to remove every obstacle between a visitor and conversion.
According to NNGroup (2024), 88% of users never return after a poor experience. For an SME, every lost visitor is a lost prospect. An eight-person accountancy firm invested €4,500 in a UX audit: average sessions rose from 45 seconds to three minutes 20 seconds and quote requests increased by 120% in three months. Read more about the value of a UX redesign.
UI design covers everything users see and touch: colour palette, typography, buttons, icons, animation and layout. A UI designer creates an attractive, coherent interface aligned with the brand while directing attention towards key actions.
According to Adobe (2024), 38% of visitors leave a site they find unattractive. UI extends beyond appearance: button contrast, font size and spacing each affect clicks. Professional website design reduces cognitive load and establishes credibility within seconds.
| 01Criterion | 02UX design | 03UI design |
|---|---|---|
| 01Focus | Overall experience and user journey | Visual interface and graphic elements |
| 02Objective | Solve a user problem | Create an attractive, functional interface |
| 03Tools | Wireframes, user flows, prototypes, A/B tests | High-fidelity mock-ups, design systems, component libraries |
| 04Deliverables | Personas, user journeys, test reports | High-fidelity mock-ups, visual guidelines, UI kit |
| 05Core skills | User research, cognitive psychology, information architecture | Graphic design, typography, colour theory, micro-interactions |
Focus
Objective
Tools
Deliverables
Core skills
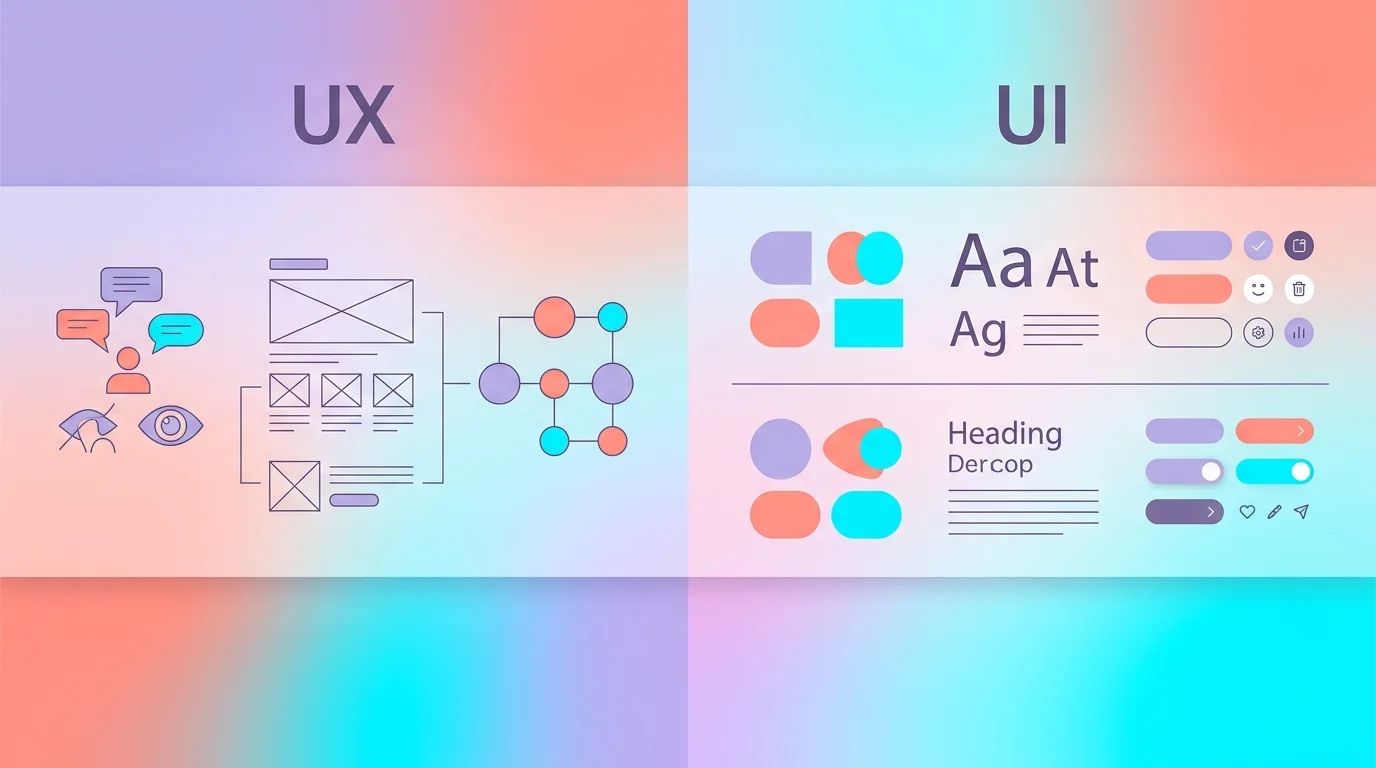
The disciplines are inseparable. A website may have flawless UX, with a logical journey, clear architecture and fast loading, yet fail through dull colours and invisible buttons. Conversely, a beautiful interface is useless if visitors cannot find what they need within three clicks.
According to McKinsey (2024), companies investing in UX and UI together outperform competitors by 200% in revenue growth. To improve conversion rate, both must progress together from the outset. A 12-person fashion retailer combined a UX audit and UI redesign: conversion rose from 1.2% to 3.8% in four months, an increase of 217%.
France's UX/UI employment market remains active. According to Hays (2025), demand rose by 18% in one year as SMEs digitised and SaaS applications grew. Salaries vary by experience, location and permanent or freelance status.
A junior UX/UI designer with up to two years' experience earns €32,000–€38,000 gross in the regions and up to €42,000 in Paris. Designers with three to five years earn €45,000–€55,000; seniors with seven or more €58,000–€75,000, and more as Lead or Head of Design. Malt (2025) gives freelance day rates from €350 for juniors to €900 for product-design specialists.
Routes include UX researcher, product designer, design manager, digital creative director and independent UX consultant. Google UX Design and NNGroup UX certifications strengthen employability and support salary expectations 10–15% higher, according to Glassdoor (2025).
| 01Profile | 02Permanent salary (gross/year) | 03Freelance day rate | 04Typical progression |
|---|---|---|---|
| 01Junior (0–2 years) | €32,000–€42,000 | €350–€500 | Mid-level UX/UI designer |
| 02Mid-level (3–5 years) | €45,000–€55,000 | €500–€700 | Senior designer / lead |
| 03Senior (7+ years) | €58,000–€75,000 | €700–€900 | Head of Design / consultant |
Junior (0–2 years)
Mid-level (3–5 years)
Senior (7+ years)
Tools shape a design team's productivity. By 2026 the ecosystem had consolidated around a few platforms, but UX and UI needs differ. According to State of UX Tools (UXTOOLS, 2025), Figma remains number one for interface design, used by 82% of respondents, ahead of Sketch at 9% and Adobe XD at 4%.
For UX, research and testing tools are increasingly important. Hotjar supplies heatmaps and session recordings. Maze automates usability tests on Figma prototypes, cutting recruitment and analysis time by 60% (Maze, 2024). UserTesting provides a participant panel and qualitative video feedback within 24 hours.
For UI, Figma combines website mock-ups, design systems and developer handoff in one collaborative tool. AI plugins such as Magician and Automator accelerate variants and component completion. Sketch remains popular on macOS, while Adobe XD integrates with Creative Cloud. Choose according to your stack and team size.
| 01Tool | 02Discipline | 03Main use | 04Price (2026) |
|---|---|---|---|
| 01Figma | UI / UX | Mock-ups, prototypes, design systems, collaboration | Free starter / €15 a month Pro |
| 02Sketch | UI | macOS mock-ups and component libraries | $12 a month |
| 03Adobe XD | UI | Prototyping and Creative Cloud integration | Included in CC (€24 a month) |
| 04Hotjar | UX | Heatmaps, session recordings, feedback | Free basic / €39 a month |
| 05Maze | UX | Automated prototype usability testing | Free limited / $99 a month |
| 06UserTesting | UX | Participant panel and qualitative video feedback | Quoted (about $15,000 a year) |
Figma
Sketch
Adobe XD
Hotjar
Maze
UserTesting
Digital design is changing rapidly under AI and new European regulation. Figma's Trends 2026 report (2025) identifies four trends reshaping UX/UI this year.
Generative AI in design workflows. Figma AI, Galileo AI and Relume generate layouts, copy and component variants in seconds. According to McKinsey (2025), teams adopting AI spend 40% less time on repetitive work, leaving more time for irreplaceable human research and testing.
Dark-pattern regulation. The EU Digital Services Act, fully applied since 2024, prohibits deceptive interfaces including pre-ticked boxes, labyrinthine cancellation and false urgency. Fines can reach 6% of worldwide revenue. Ethical design is a legal duty in 2026 (European Commission, 2024).
Micro-interactions and motion. Subtle button feedback, page transitions and progress indicators improve fluidity and reduce errors by 15% according to NNGroup (2025). Design systems now include standardised motion tokens.
Design systems at scale. SMEs increasingly adopt lightweight design systems for faster development and consistency. According to Sparkbox (2025), 72% of companies above ten employees have one, compared with 45% in 2022. Reusable components cut front-end development time by 30–50%.
Digital accessibility is no longer optional in France: since 2024, law has required companies above €250,000 annual revenue to comply with RGAA, aligned with WCAG 2.2 AA. Penalties can reach €50,000 per non-compliant site (DINUM, 2024).
Accessibility affects every UX and UI choice: 4.5:1 minimum text contrast, complete keyboard navigation, image alt text, coherent headings and explicit form labels. According to WebAIM (2025), 96% of analysed home pages still contain automatically detectable errors, creating both a problem and an opportunity.
Universal design goes beyond compliance. Captions help in noisy environments, high contrast in sunlight and keyboard navigation helps power users. According to Microsoft Inclusive Design (2024), designing for edge cases improves the experience for 100% of users. Building accessibility into UX adds an estimated 5–10% to initial design cost, compared with 25–40% when retrofitted. Our page on UX Redesign explains the next step.
Étape 1
Interview users, analyse analytics and create personas. Baymard Institute (2025) says 70% of basket abandonment comes from UX friction identifiable here. Understand who visitors are and what they need.
Étape 2
Structure content and journeys with low-fidelity wireframes. Each page should answer one intent. Sound website architecture reduces clicks between arrival and conversion.
Étape 3
Turn wireframes into high-fidelity mock-ups with colour, typography, interactive components and motion. Test at least two variants of key pages, heroes and forms.
Étape 4
Test with five to eight target users. According to NNGroup (2023), five participants find 85% of usability problems. Record sessions and identify repeated friction.
Étape 5
Fix friction, validate Core Web Vitals and RGAA accessibility, then deploy. Cover mobile and desktop with responsive design and schedule post-launch tests at 30 and 90 days.
You may work in a team where UI and UX are separate disciplines, but the best products emerge when both collaborate from the project's first day.
“We thought our website was fine, but the UX/UI audit found 23 points of friction. After the redesign, quote requests tripled in two months and bounce rate fell by 34 points.”
Our experts analyse the interface and design a user journey that converts. Every project includes a free UX audit.
Keep exploring

A project in mind?
Start with a free audit grounded in your goals, website and data.
Discutons de votre projet
30 min · Google Meet
Choisissez le créneau qui vous convient dans notre calendrier. On analyse votre situation avant l’appel pour aller droit au but.
Finding available times...