

Audit SEO

La Refonte insights
Measure your site's speed in five minutes with Google PageSpeed Insights, understand your Core Web Vitals and pinpoint the issues driving prospects away, without the technical jargon.
Audit SEO

SEO

Refonte
Testing a website's performance means objectively measuring its loading speed, visual stability and responsiveness.
These are the three areas Google assesses when deciding whether a site deserves to rank well.
According to Google (2023), 53% of mobile visitors leave a page if it takes more than three seconds to load.
If you have never run an audit of your website, you may have been losing prospects silently for months.
This guide shows you how to analyse your site's performance in under five minutes with Google PageSpeed Insights, then identify the priority issues to fix this week.

Each additional second of loading time reduces conversions by 7%, according to an Akamai study cited by HubSpot (2024). This is not an abstract estimate.
One fast-food client, whose site received 4,800 mobile visits a month, had an average loading time of 6.2 seconds.
After compressing its images and enabling server caching, that figure fell to 2.3 seconds. The result was a 31% rise in clicks through to the booking form over eight weeks.
A slow site costs you quietly, every day, without any visible warning in Google Analytics 4.
Google has included Core Web Vitals as a ranking signal in its algorithm since June 2021, according to the official Google Search Central documentation (2024).
A slow site is penalised twice: visitors leave as soon as they arrive, and Google places it lower in the search results.
Core Web Vitals measure how quickly the main content appears, how responsive the page is to interactions and how visually stable it remains. For an SME whose website generates leads, ignoring these metrics is like investing in SEO without checking the foundations. Our complete guide to Core Web Vitals explains each signal and the practical steps that improve it.
LCP measures the time it takes to display the largest visible element on your page, usually the hero image, main heading or a product banner.
Google regards an LCP below 2.5 seconds as 'good'. Above four seconds, it is 'poor'.
According to Semrush (2024), 72% of web pages have an LCP above 2.5 seconds on mobile.
The most common causes are oversized, uncompressed images, overloaded shared hosting and JavaScript that blocks the page from rendering before its content appears.
In March 2024, Google replaced FID with INP (Interaction to Next Paint) in its official Core Web Vitals.
INP measures how quickly your page responds to every interaction, including clicks, taps and keyboard input, rather than only the first one.
An acceptable INP is below 200 milliseconds. A score above 500 ms indicates a page that feels sluggish to navigate and frustrates users.
WordPress sites burdened with poorly optimised JavaScript plugins are particularly exposed to this problem, according to Google Search Central (2024).
CLS measures unexpected movement on your page: a button shifting at the precise moment a user tries to click it, for example. A CLS score below 0.1 is good.
These shifts happen when images have no dimensions defined in the HTML, or when adverts load after the content and push existing elements out of place.
For an SME with a contact form or 'Request a quote' button, a high CLS score means missed clicks.
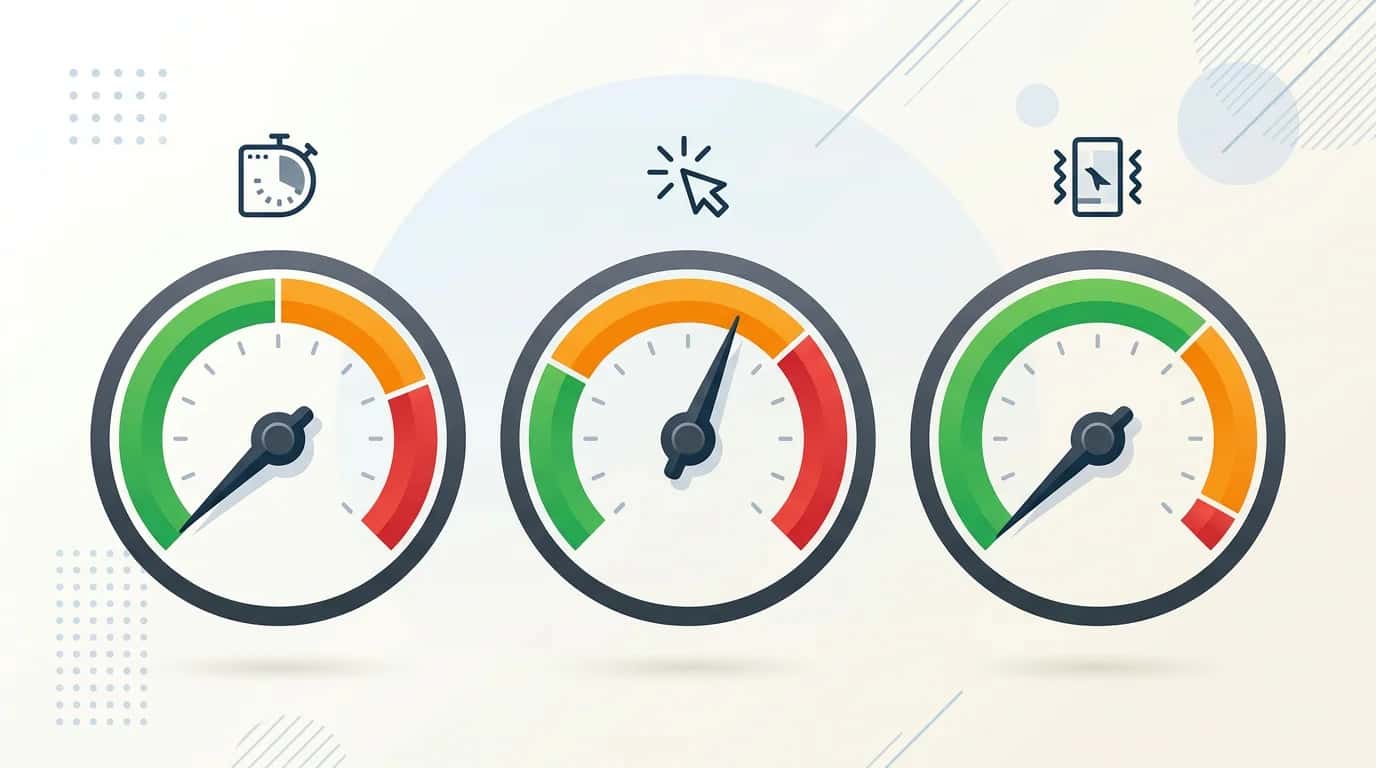
Go to pagespeed.web.dev, paste in the URL of your home page or, better still, your main service page, then click 'Analyse'. Google PageSpeed Insights runs two assessments: a summary of field data gathered from real visitors through the Chrome UX Report, and a test simulating a mobile device on a standard 4G connection.
Your results appear in 30 seconds. Always look at mobile first: according to Google (2024), mobile devices account for more than 60% of web traffic worldwide.
Google PageSpeed Insights awards a score from 0 to 100. Green (90–100) means fast. Amber (50–89) indicates room for improvement.
Red (0–49) flags a critical issue affecting your search visibility and conversions today.
Most SME websites show a marked gap between mobile, often 30–55, and desktop, often 70–90.
This gap points to images that have not been resized for mobile, render-blocking JavaScript or a poorly optimised theme.
Do not stop at the overall score: go straight to the 'Opportunities' section to see the potential saving measured in seconds.
Google PageSpeed Insights lists each detected problem alongside its estimated impact in seconds.
The three most common causes on French SME websites are uncompressed images (an impact of two to four seconds), no browser caching (one to two seconds) and blocking third-party JavaScript (0.5 to two seconds).
Two other recurring causes are poorly optimised web fonts (0.3 to one second) and slow hosting (one to three seconds).
Each problem has a specific, measurable technical remedy. Our SEO redesign service includes a full audit of these areas and documented fixes.
| Tool | Price | Strengths | Limitations | Best for |
|---|---|---|---|---|
| Google PageSpeed Insights | Free | Real-user data, tied to Google's algorithm | No historical tracking | Initial diagnosis, SMEs without a developer |
| Google Lighthouse | Free | Built into Chrome, complete local audit | Simulates only one connection type | Developers, pre-deployment testing |
| GTmetrix | Free / Premium from $5 a month | Loading video, detailed waterfall | Free plan: one test per hour | Identifying slow resources |
| Pingdom | Free / Monitoring from $10 a month | Continuous monitoring, real-time alerts | Ongoing monitoring costs extra | Monitoring after optimisation |
Google Lighthouse is available in Chrome with no installation required.
Open the developer tools (F12, or right-click and choose Inspect), select the 'Lighthouse' tab, choose 'Mobile' and 'Performance', then click 'Analyse page load'.
The audit takes 30 to 60 seconds and produces a detailed report that times every resource.
The key difference from Google PageSpeed Insights is that Lighthouse simulates a connection from your computer, whereas PageSpeed Insights aggregates data from real users.
According to Google Developers (2024), the two tools complement one another when conducting a thorough web performance diagnosis.
GTmetrix provides a visual loading waterfall that shows exactly which resource is slowing down your page, and by how many milliseconds.
One SME client in the construction sector used GTmetrix to identify a live-chat plugin that was adding 1.8 seconds to mobile LCP.
Disabling the plugin lifted its PageSpeed score from 41 to 78 in a single step, without any change to the design.
According to GTmetrix (2024), the median web page now exceeds 2.3 MB, mainly because of uncompressed images and third-party tracking scripts.
A mobile PageSpeed score below 50 means your site is losing visitors around the clock.
The problems are often structural: overloaded shared hosting, raw uncompressed images or a WordPress theme weighed down by unnecessary scripts.
Quick wins include compressing images with TinyPNG (free), enabling a caching plugin such as WP Rocket or W3 Total Cache and disabling unused plugins. These three steps alone can raise a score from 35 to 55–60 within a few hours. To go further, a targeted WordPress redesign is often the most cost-effective option at this level.
A score between 50 and 90 means the site works, but is not performing to its full potential.
A mobile score of 65 may seem acceptable until you realise that a competitor scoring 85 is targeting the same searches with a better conversion rate.
According to a Deloitte and Google study (2022), improving mobile speed by 0.1 seconds increases retail conversions by 8%. At this stage, improvements are often technical: lazy-loading images, preloading critical fonts, and minifying CSS and JavaScript. Our Core Web Vitals guide explains each step and the expected gains.
A score above 90 puts your site among the top 10% of websites for performance, according to Semrush data (2024). The priority is no longer improvement, but consistency.
WordPress sites change constantly: every plugin update or new widget can quietly erode the score.
Set up monthly monitoring through Pingdom or Google Search Console, under 'Page experience', to catch any regression before it affects your rankings or conversion rates.
Three changes account for 80% of the performance gains on a typical SME website. First, convert and compress images in WebP format.
Most sites lose 1.5 to three seconds on this issue alone, according to Google PageSpeed Insights (2024).
Second, enable browser and server caching. Returning visitors will load resources from their local cache, cutting perceived loading time to under a second.
Third, defer non-critical JavaScript. Social media scripts, tracking pixels and chat widgets often load before the visible content, delaying the page's main display.
Technical optimisation is enough if your site is less than four years old, has a PageSpeed score above 40 and still has a content structure suited to your needs.
A redesign becomes necessary when the platform itself is structurally responsible for poor performance.
One client in the vocational education sector tried three rounds of optimisation on its Wix site before discovering that the platform capped its score at 52, whatever changes were made.
Migrating to WordPress lifted the website performance benchmark to 87, and registrations rose by 22% in two months. Some platforms cannot be rescued through optimisation alone.
Testing your website's performance takes five minutes with Google PageSpeed Insights.
The results tell you whether visitors are leaving because of slow speeds, and which pages are losing the most conversions.
Most SMEs discover a mobile score below 60. It can usually be fixed without a full redesign.
The answer may be targeted technical optimisation, requiring a few days of work, or a redesign if the current platform is the underlying obstacle.
Every week you keep a slow website is a week of organic traffic handed to better-ranked competitors.
Has your audit uncovered any bottlenecks? Our team will review your site free of charge and provide a costed, no-obligation action plan. Request your free performance review
Core Web Vitals, loading times and technical optimisation: we make your website perform.
Keep exploring


A project in mind?
Start with a free audit grounded in your goals, website and data.
Discutons de votre projet
30 min · Google Meet
Choisissez le créneau qui vous convient dans notre calendrier. On analyse votre situation avant l’appel pour aller droit au but.
Finding available times...