

Refonte
La Refonte insights
The average bounce rate for an SME brochure site is 50–65%. Above 75%, you lose dozens of leads every month. See 2026 benchmarks, causes, tools and a practical action plan.

Refonte

SEO

IA
According to Semrush (2024), the average bounce rate for an SME brochure site in France is between 50% and 65%.
If Google Analytics 4 shows 75% or more, you are losing dozens of qualified visitors every month before they see a single service page.
This guide provides industry benchmarks, the five most common causes among SMEs and a clear route below 50%, with or without a complete redesign.

Bounce rate is the percentage of sessions in which a visitor leaves after viewing a single page without interacting. In 2023, Google Analytics 4 replaced this metric with engagement rate: a session is now 'engaged' if it lasts more than ten seconds, triggers an event or includes at least two page views. Bounce rate in GA4 is the exact inverse of engagement rate. In practice, GA4 figures cannot be compared with the old Universal Analytics. If you migrated in 2023, compare GA4 data only with other GA4 data.
Industry benchmarks vary considerably, and using the wrong comparison invalidates the diagnosis. According to Semrush (2024), these are the ranges to remember:
| Website type | Average bounce rate | Warning threshold |
|---|---|---|
| Ecommerce | 20–45% | > 55% |
| B2B services (SME) | 25–55% | > 65% |
| SME brochure site | 50–65% | > 75% |
| Blog / content | 65–85% | > 90% |
| Advertising landing page | 60–80% | > 85% |
A B2B services website with a 72% bounce rate is not merely 'at the upper end of average'. It means more than half of visitors leave without finding what they need. For SMEs investing in SEO or Google Ads, every unnecessary percentage point represents wasted money. A complete website audit can combine bounce rate with paid-traffic data and put an exact value on this loss.
Engagement rate, meaning engaged sessions divided by all sessions, and bounce rate are now two sides of the same GA4 coin: bounce rate = 100% − engagement rate.
An engagement rate of 38% means a bounce rate of 62%.
But take care: a visitor who reads your blog article for eight minutes without clicking would be counted as a 'bounce' in GA4 if the session lasted less than ten seconds, which is rare.
For long-form content, time on page remains a better measure of genuine engagement than raw bounce rate.
According to Google (2024), 53% of mobile visitors leave a page that takes more than three seconds to load. This is not an abstract statistic: your SEO and Google Ads budgets are being wasted before someone has read the heading. Core Web Vitals measure this performance through LCP (Largest Contentful Paint, the loading of main content), INP (Interaction to Next Paint) and CLS (Cumulative Layout Shift). An LCP above 2.5 seconds correlates directly with higher bounce rates. Test your site with PageSpeed Insights or WebPageTest to obtain a score in three minutes.
Put bluntly, if your site is more than four years old, it is probably not genuinely mobile-first. According to Statista (2025), mobile devices account for 62% of worldwide web traffic.
Yet in redesign projects handled by La Refonte, mobile pages consistently show bounce rates 15 to 25 points above their desktop equivalents.
A button that is too small, text that requires zooming or a broken hamburger menu can each drive a visitor away.
Google has prioritised the mobile version of websites for indexation since 2021 through Mobile-First Indexing. A poor mobile site therefore harms visibility and retention at once.
Someone who searches Google for 'website redesign cost' expects prices, not 2,000 words on the history of web design.
If a home page or blog article does not answer the precise intent within the first five seconds, the visitor leaves immediately.
According to Ahrefs (2024), 90.63% of web pages receive no organic traffic from Google.
One major reason is that their content does not align with real search intent.
A high bounce rate is often the first symptom of this mismatch, even before Google rankings decline.
A visitor may like your home page but leave if the next click is unclear. Navigation, internal links and visual hierarchy all directly affect retention. A menu with eight equally weighted sections and no emphasis on key pages demands a cognitive effort that visitors refuse to make. According to HubSpot (2024), sites whose internal links follow pillar pages and topic clusters average 40% more page views per session. Improving internal links is one of the most underestimated ways to reduce bounce rate without a complete redesign.
A visitor lands on your page, reads the heading, scans the visible content for three seconds without scrolling, and finds no reason to stay.
There is no invitation to continue, visible action button or immediate value proposition.
According to Unbounce (2024), landing pages with a call to action above the fold convert 84% better than those that bury it at the bottom.
The principle also applies to blog articles and service pages: if the next step is unclear within five seconds, bounce rate soars.
An accountancy firm in Lyon that worked with us had a 78% bounce rate on its home page.
We revised the opening message to make a specific promise: 'SME tax return filed within five working days'.
Next came an above-the-fold 'Book an appointment' button and compressed images.
The bounce rate fell to 48% within six weeks, without a website redesign.
The work cost €900 and generated four new qualified prospects in the first month.
The five-second rule is simple: visitors must understand what you do, who it is for and what they should do next within five seconds. If the current page fails this test, start there.
Internal links turn a single visit into a journey. Every blog article is an entrance: if readers find no natural route to a service page or related content, they leave when they finish. The most effective SME approach is to link every article to two related pieces in the same cluster and one relevant service page, always using descriptive rather than generic anchor text. According to Ahrefs (2024), pages linked from several articles in the same cluster see an average 40% rise in organic traffic over six months. Our Core Web Vitals guide explains how to combine internal linking with technical optimisation to maximise retention.
Three steps cut loading time by 30–50% without touching source code. First, convert all images to WebP using Squoosh or ShortPixel, reducing their weight by 25–35% on average.
Next, enable browser caching and lazy loading for off-screen images, a native WordPress feature since 2019.
Finally, remove unused JavaScript plugins. Each third-party script, from chatbots and social widgets to advertising pixels, adds 100–500 ms.
According to Google (2024), cutting LCP from four seconds to 2.5 seconds reduces ecommerce page bounce rates by 24% on average. Any junior web developer can make these changes.
A communications agency in Bordeaux had an 82% bounce rate on its 'Website design' page. The problem was that the page opened with the agency's history and values.
It failed to answer the visitor's questions: 'How much will it cost and how long will it take?'
After restructuring, indicative prices appeared in the first paragraph, a five-step process was visible above the fold and a quantified testimonial read 'six-week delivery, 35% more leads in three months'.
The bounce rate fell from 82% to 51% within four weeks.
The rule is simple: list the three questions a visitor asks before reaching your page and answer them within the first 200 words.
If your current page does not, every additional day wastes budget.

In Google Analytics 4, the 'Pages and screens' report under Reports → Engagement displays the engagement rate for each page.
Sort by session volume in descending order and filter for engagement rates below 30%. These pages are your priorities.
For SMEs, the three busiest pages often account for 60–70% of all sessions. Focus on these first.
GA4 also lets you segment by device type. Always compare mobile and desktop engagement rates.
A gap above 20 points signals a mobile problem that neither SEO nor advertising can compensate for.
Microsoft Clarity is one of the most underused tools among French SMEs, despite being entirely free.
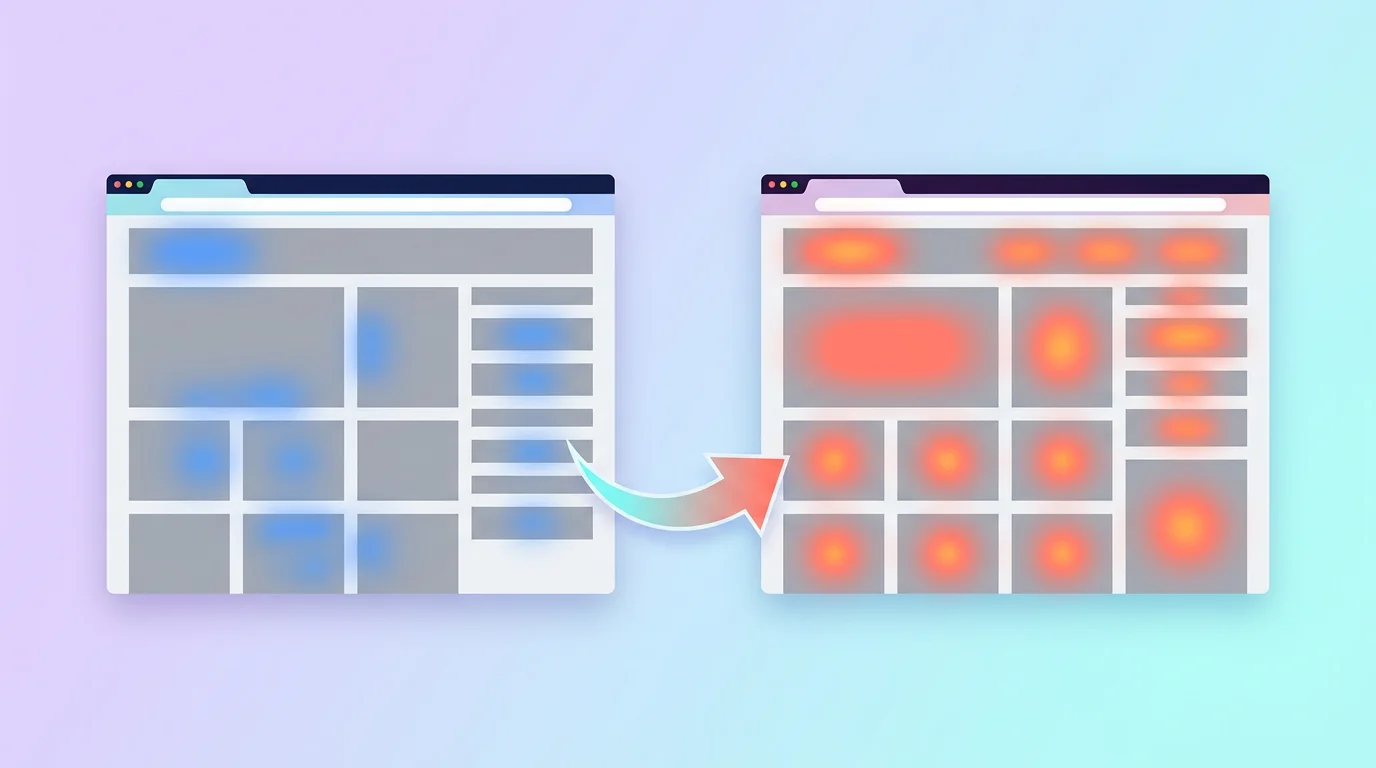
It records sessions on video, generates click and scroll heatmaps, and automatically detects 'rage clicks' on unresponsive elements and 'dead clicks'.
Install Clarity in five minutes by pasting a JavaScript snippet into the site or using the official WordPress plugin.
In practice, watch ten to 15 sessions to see how visitors interact. In practice, watch ten to 15 recordings from your main service page.
In practice, watch ten to 15 recorded sessions: you will see exactly where people stop scrolling.
This depth of diagnosis often replaces a full day of user testing by showing what people click fruitlessly and when they leave.
This depth of diagnosis often replaces a full day of user testing.
Google Search Console does not measure bounce rate directly, but provides CTR and impressions for each query.
By combining Search Console and GA4 through their native integration, you can find searches that generate clicks but little engagement.
This is the most reliable sign of a mismatch between the title and meta description and the page's real content.
According to Google (2024), pages with a CTR below 2% despite good rankings often suffer from a mismatch between the SEO promise and actual content.
Correcting that mismatch reduces bounce rate and improves rankings at the same time.
A high bounce rate can be a surface problem fixed within weeks. In 30–40% of the cases we handle, however, it points to something deeper.
The cause may be incoherent information architecture, ageing technology incompatible with Core Web Vitals standards or a content strategy that no longer reflects current visitor expectations.
Surface optimisation is not enough in these cases.
The warning signs are cumulative: a bounce rate above 70% for more than 12 months.
LCP still above four seconds after image compression, navigation unchanged since the site launched, and no internal links.
If three of these four criteria apply, isolated improvements will be insufficient.
Consider a B2B services SME receiving 500 monthly visitors, with an 80% bounce rate and a 3% average conversion rate among those who stay. That gives 100 engaged visitors × 3% = three leads a month. Cutting bounce rate to 50%, a reasonable target after redesign, creates 250 engaged visitors × 3% = 7.5 leads a month. That is 2.5 times more leads from the same traffic budget. If an average customer is worth €5,000, the difference represents €225,000 in additional revenue over 18 months. An SEO- and conversion-led redesign often pays for itself in three to six months through this lever alone.
A partial redesign of landing pages, the home page and main service page is appropriate when the site is less than four years old, the CMS is current and problems are concentrated on three to five known pages. It costs €3,000–€8,000 depending on scope and takes four to eight weeks. A complete redesign is needed when the site is more than five years old, its technology cannot meet Core Web Vitals standards or the information architecture needs rebuilding from scratch. A complete SME website redesign costs €8,000–€30,000 depending on size, with measurable six-month ROI tracked through GA4. We always begin with a two-hour diagnosis before recommending either route.
Your current bounce rate is only a number. What matters is what you do with it.
Start with GA4 and Microsoft Clarity this week. Two hours is enough to identify your three priority pages and measure the gap against industry benchmarks.
Decide whether quick wins are enough or more fundamental work is required.
Both tools are free, installation takes less than a day and the first data arrives within 48 hours.
If bounce rate has remained above 65% for several months and surface optimisation has not delivered lasting improvement, the problem is probably structural. We have helped more than 80 French SMEs make this diagnosis: some solved the problem by rebuilding three pages, while others needed a complete redesign. A two-hour audit reveals the difference. Book a free diagnosis and leave with a practical action plan, whether you implement it with us or independently.
UX, UI and responsive design: we create websites that look good and work hard for SMEs.
Keep exploring


A project in mind?
Start with a free audit grounded in your goals, website and data.
Discutons de votre projet
30 min · Google Meet
Choisissez le créneau qui vous convient dans notre calendrier. On analyse votre situation avant l’appel pour aller droit au but.
Finding available times...